Data Visuals
Tableau dashboards and data visualizations that turn complex data into clear, compelling stories.
Viz Design Catalog
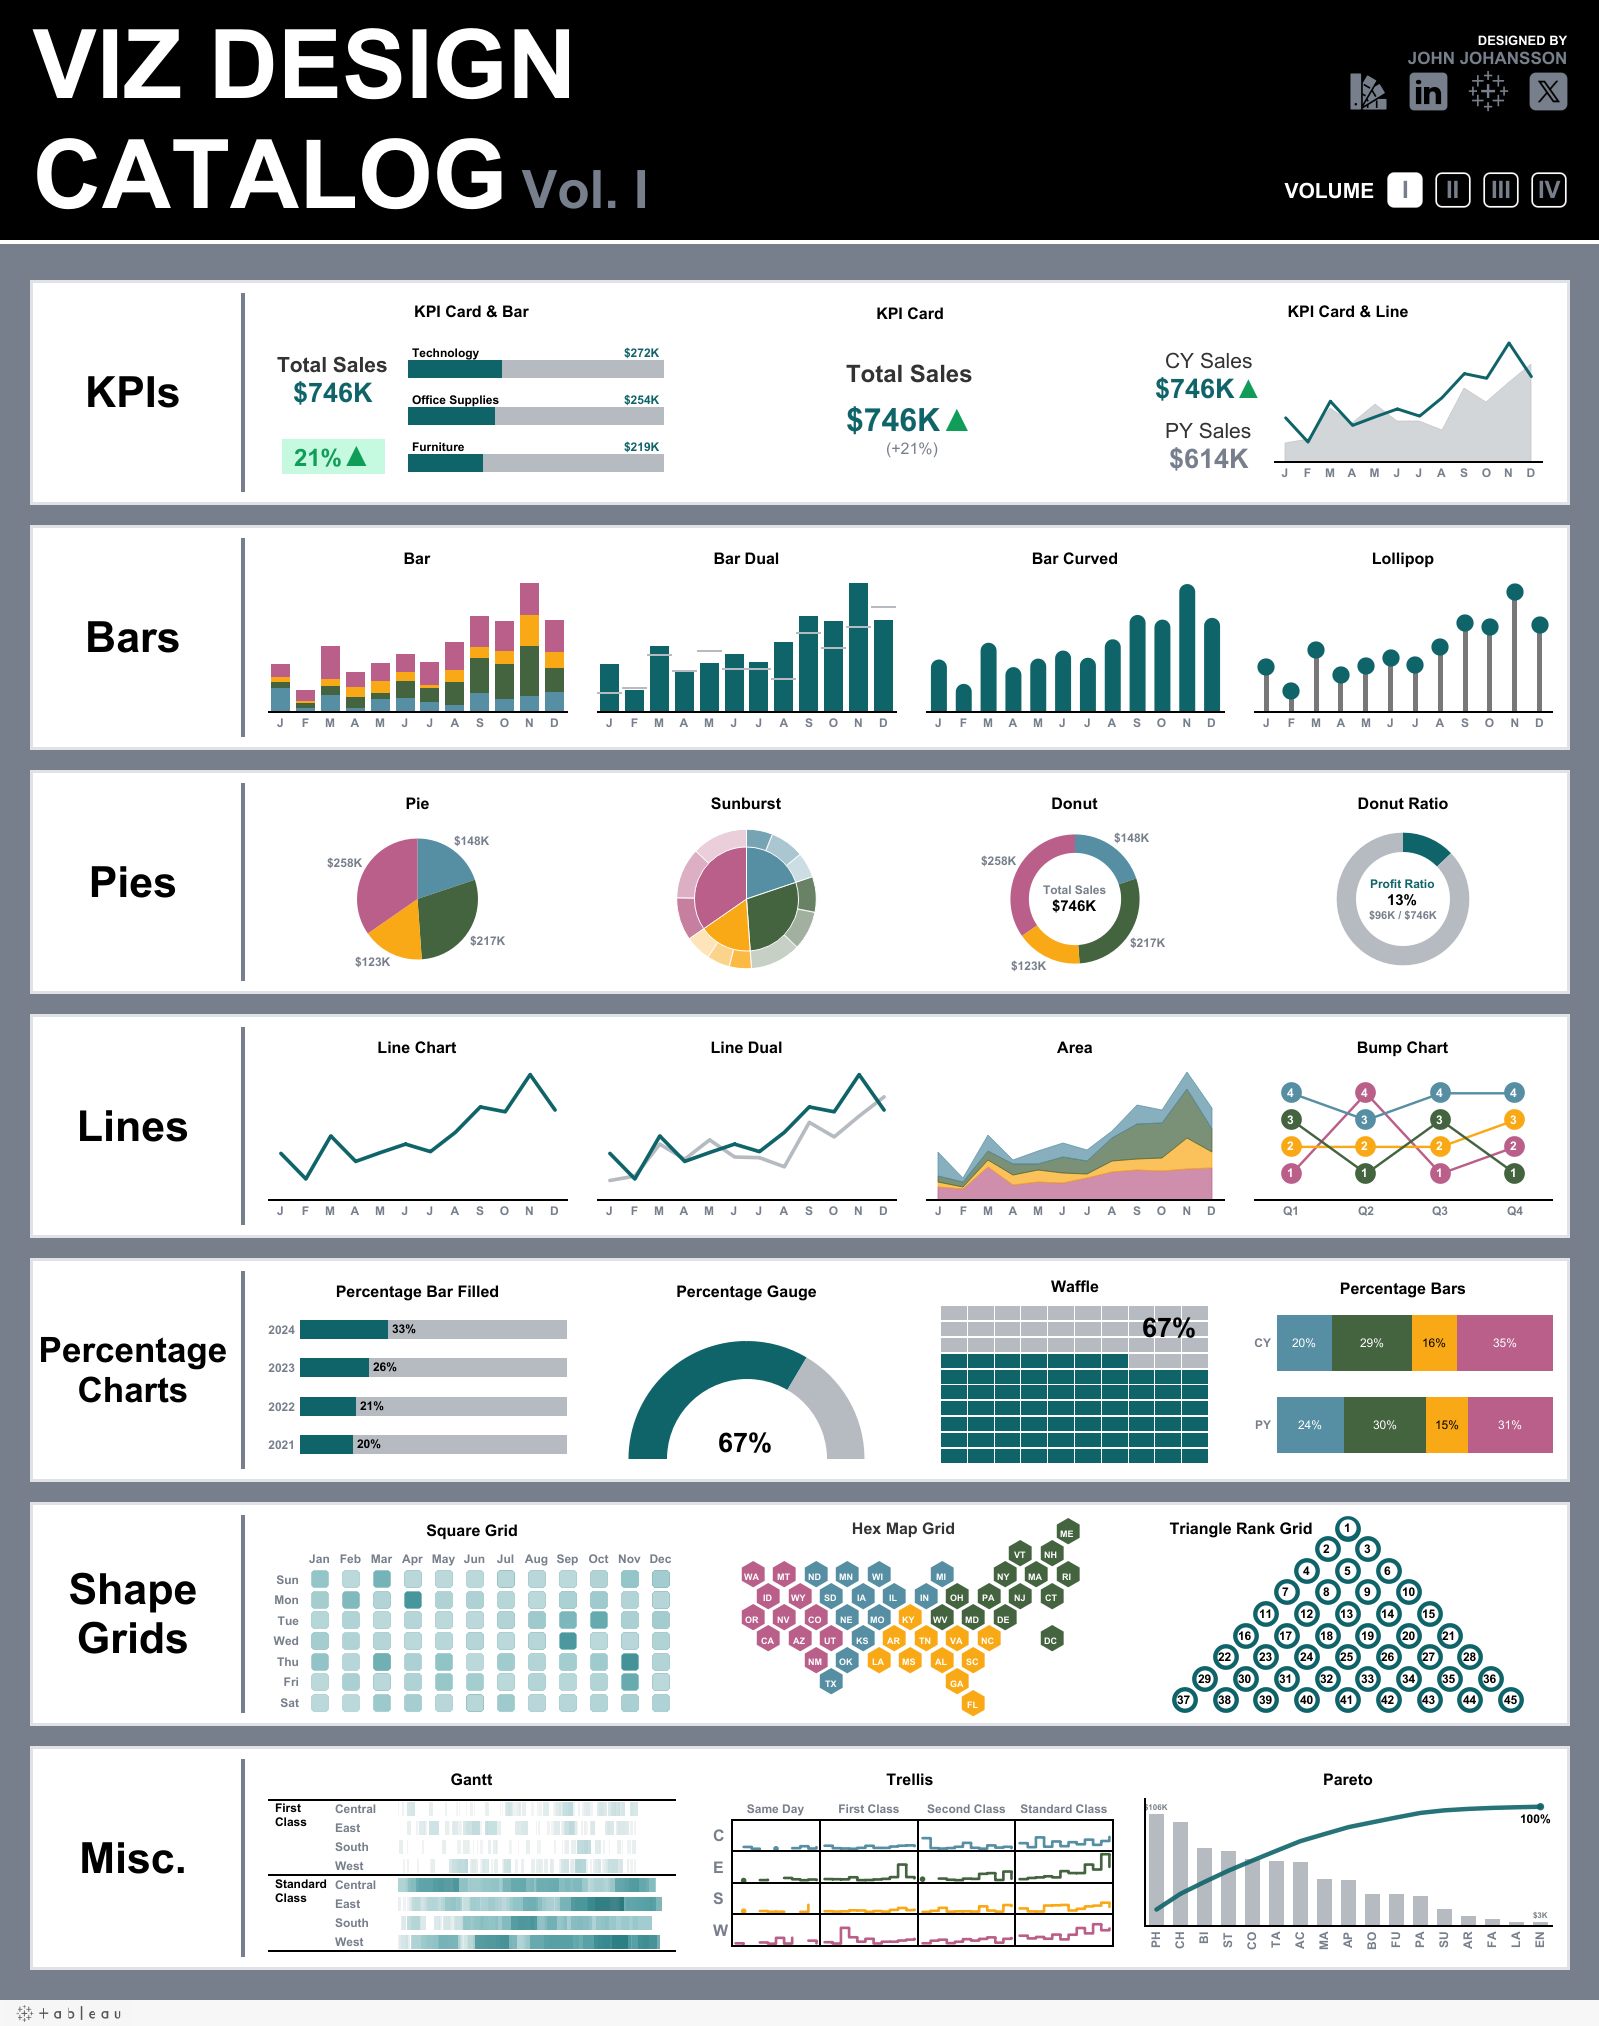
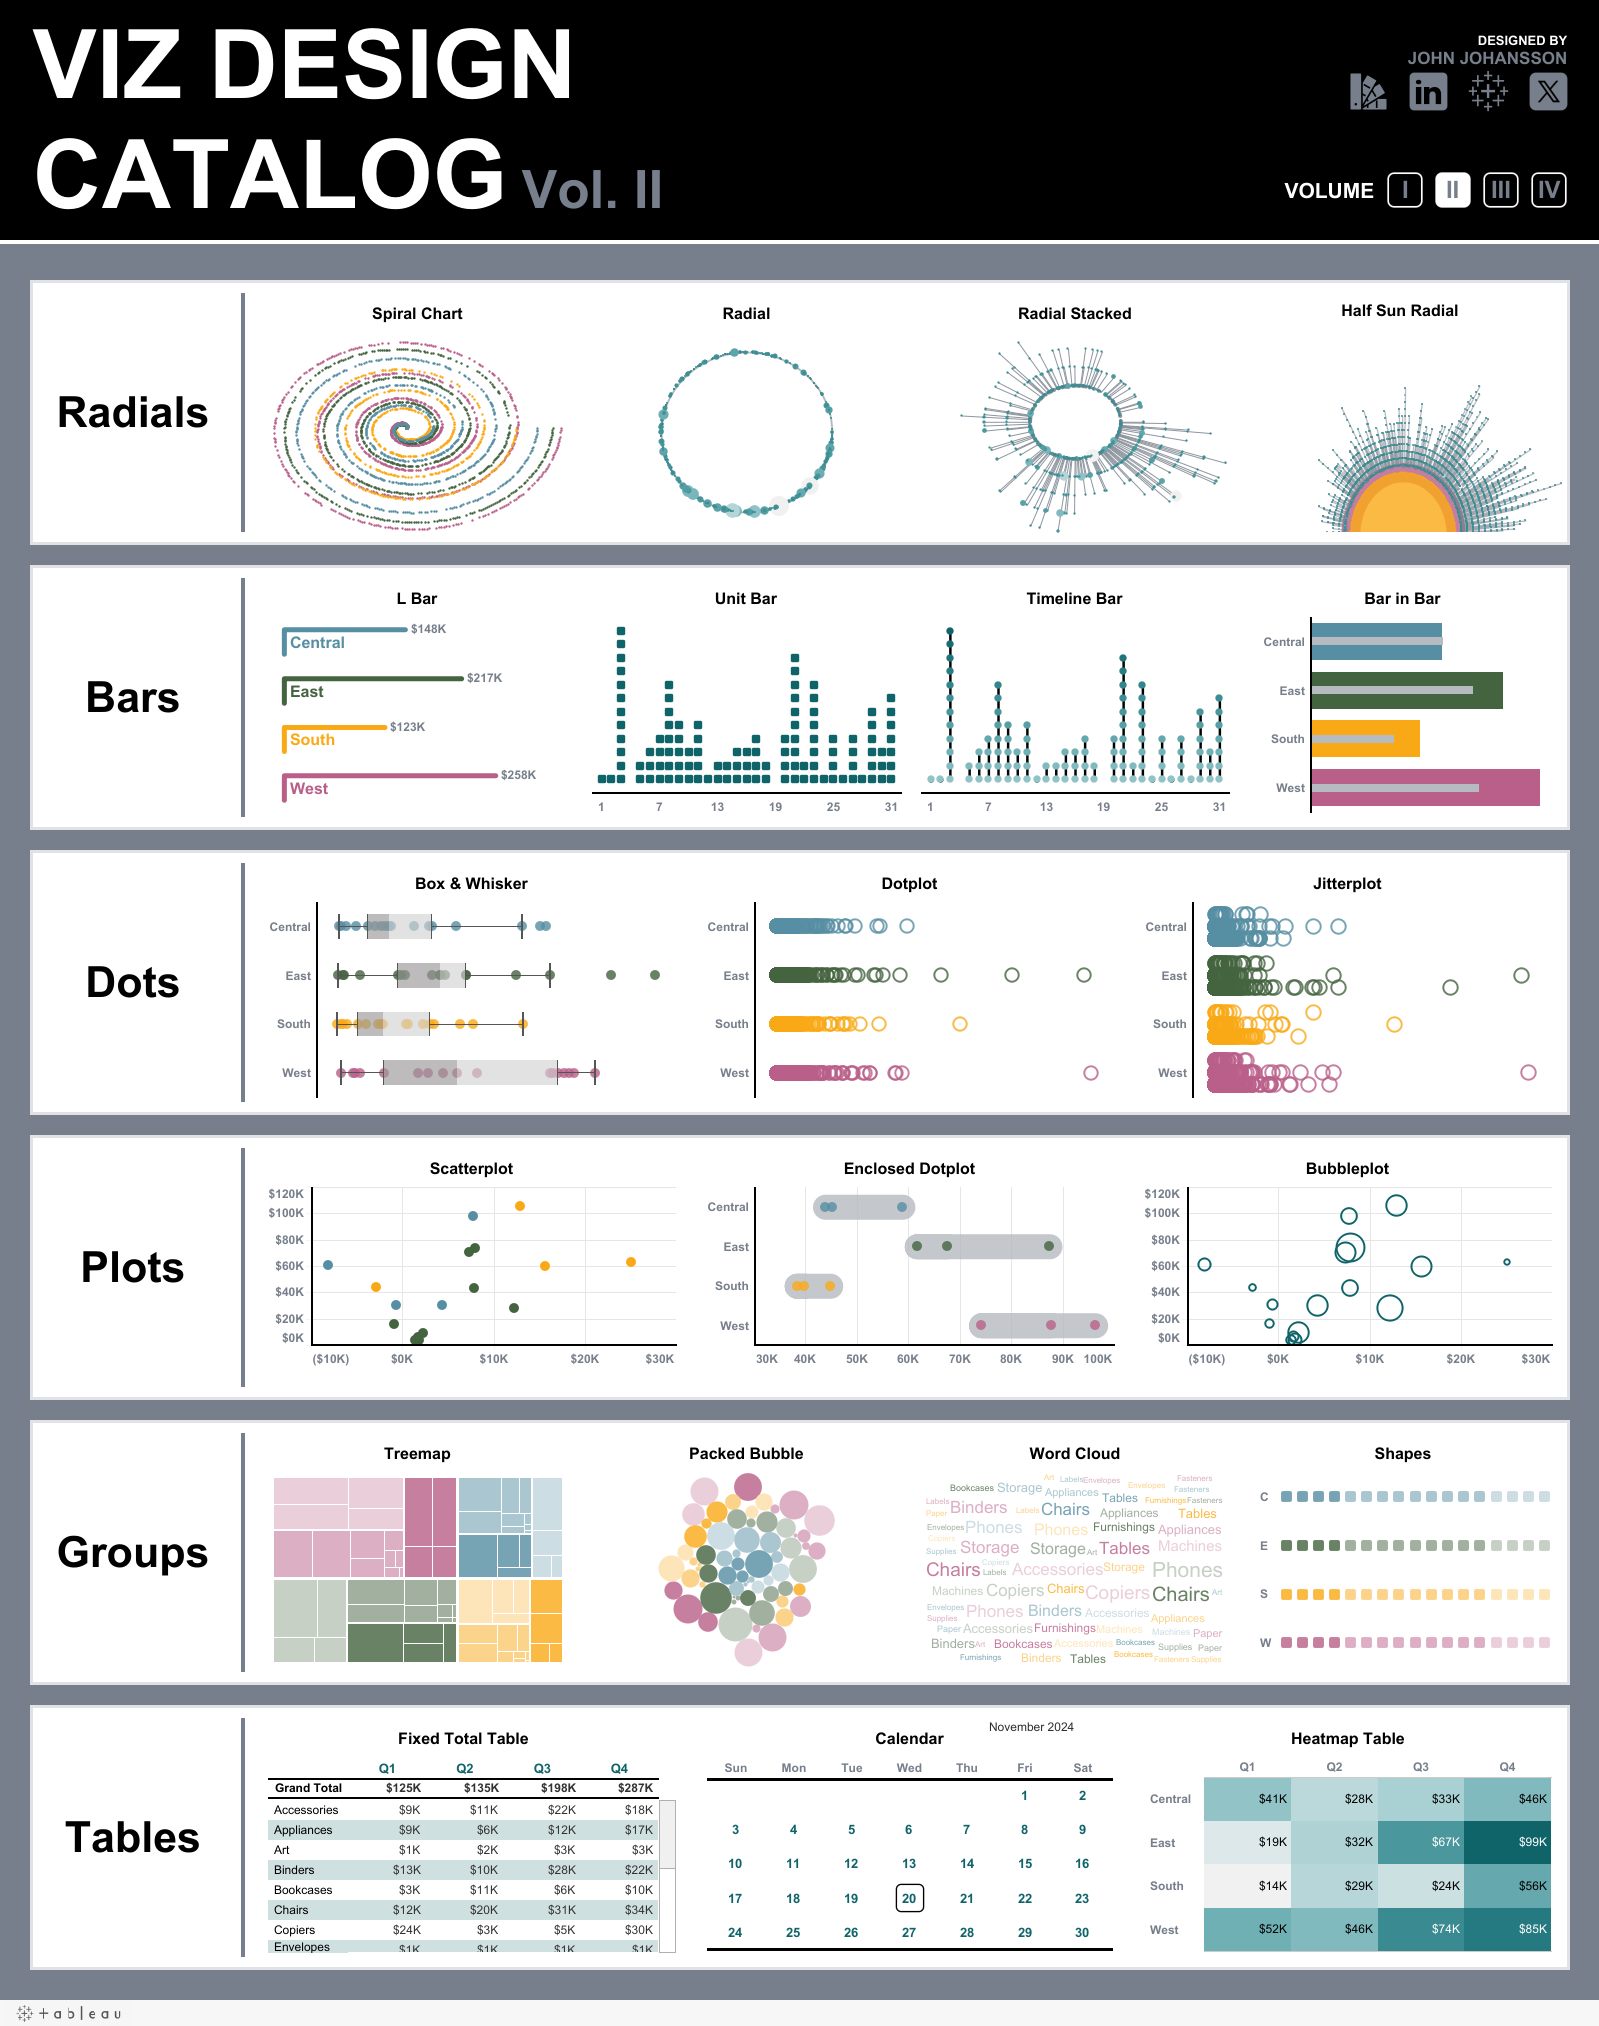
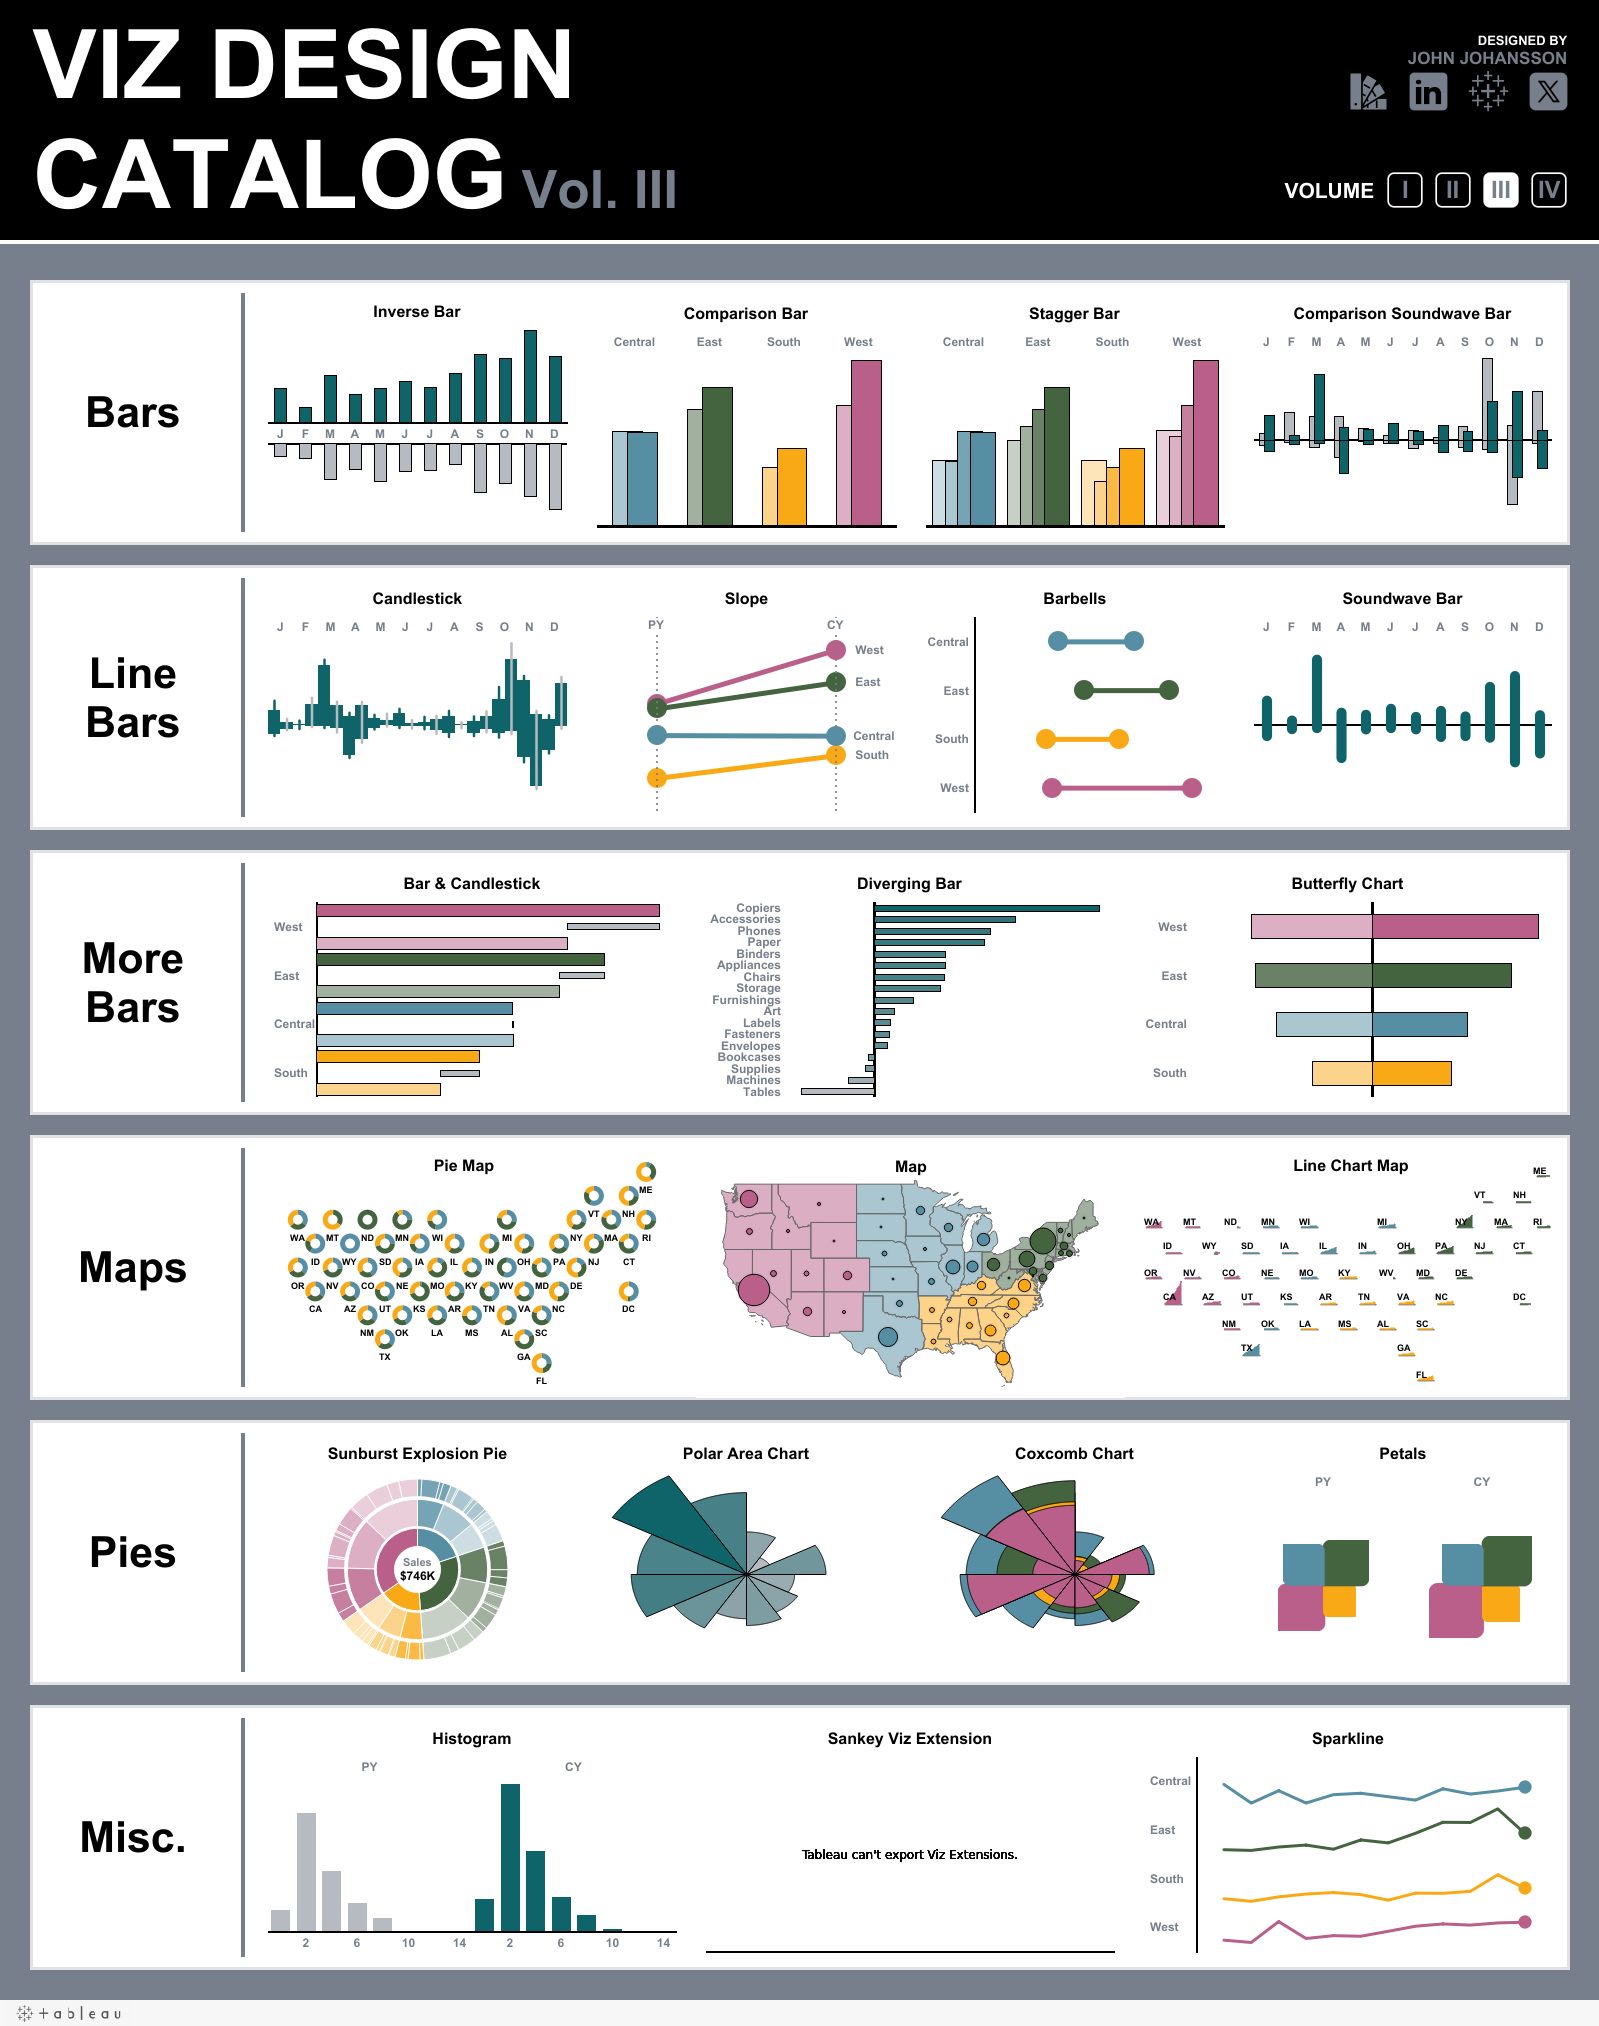
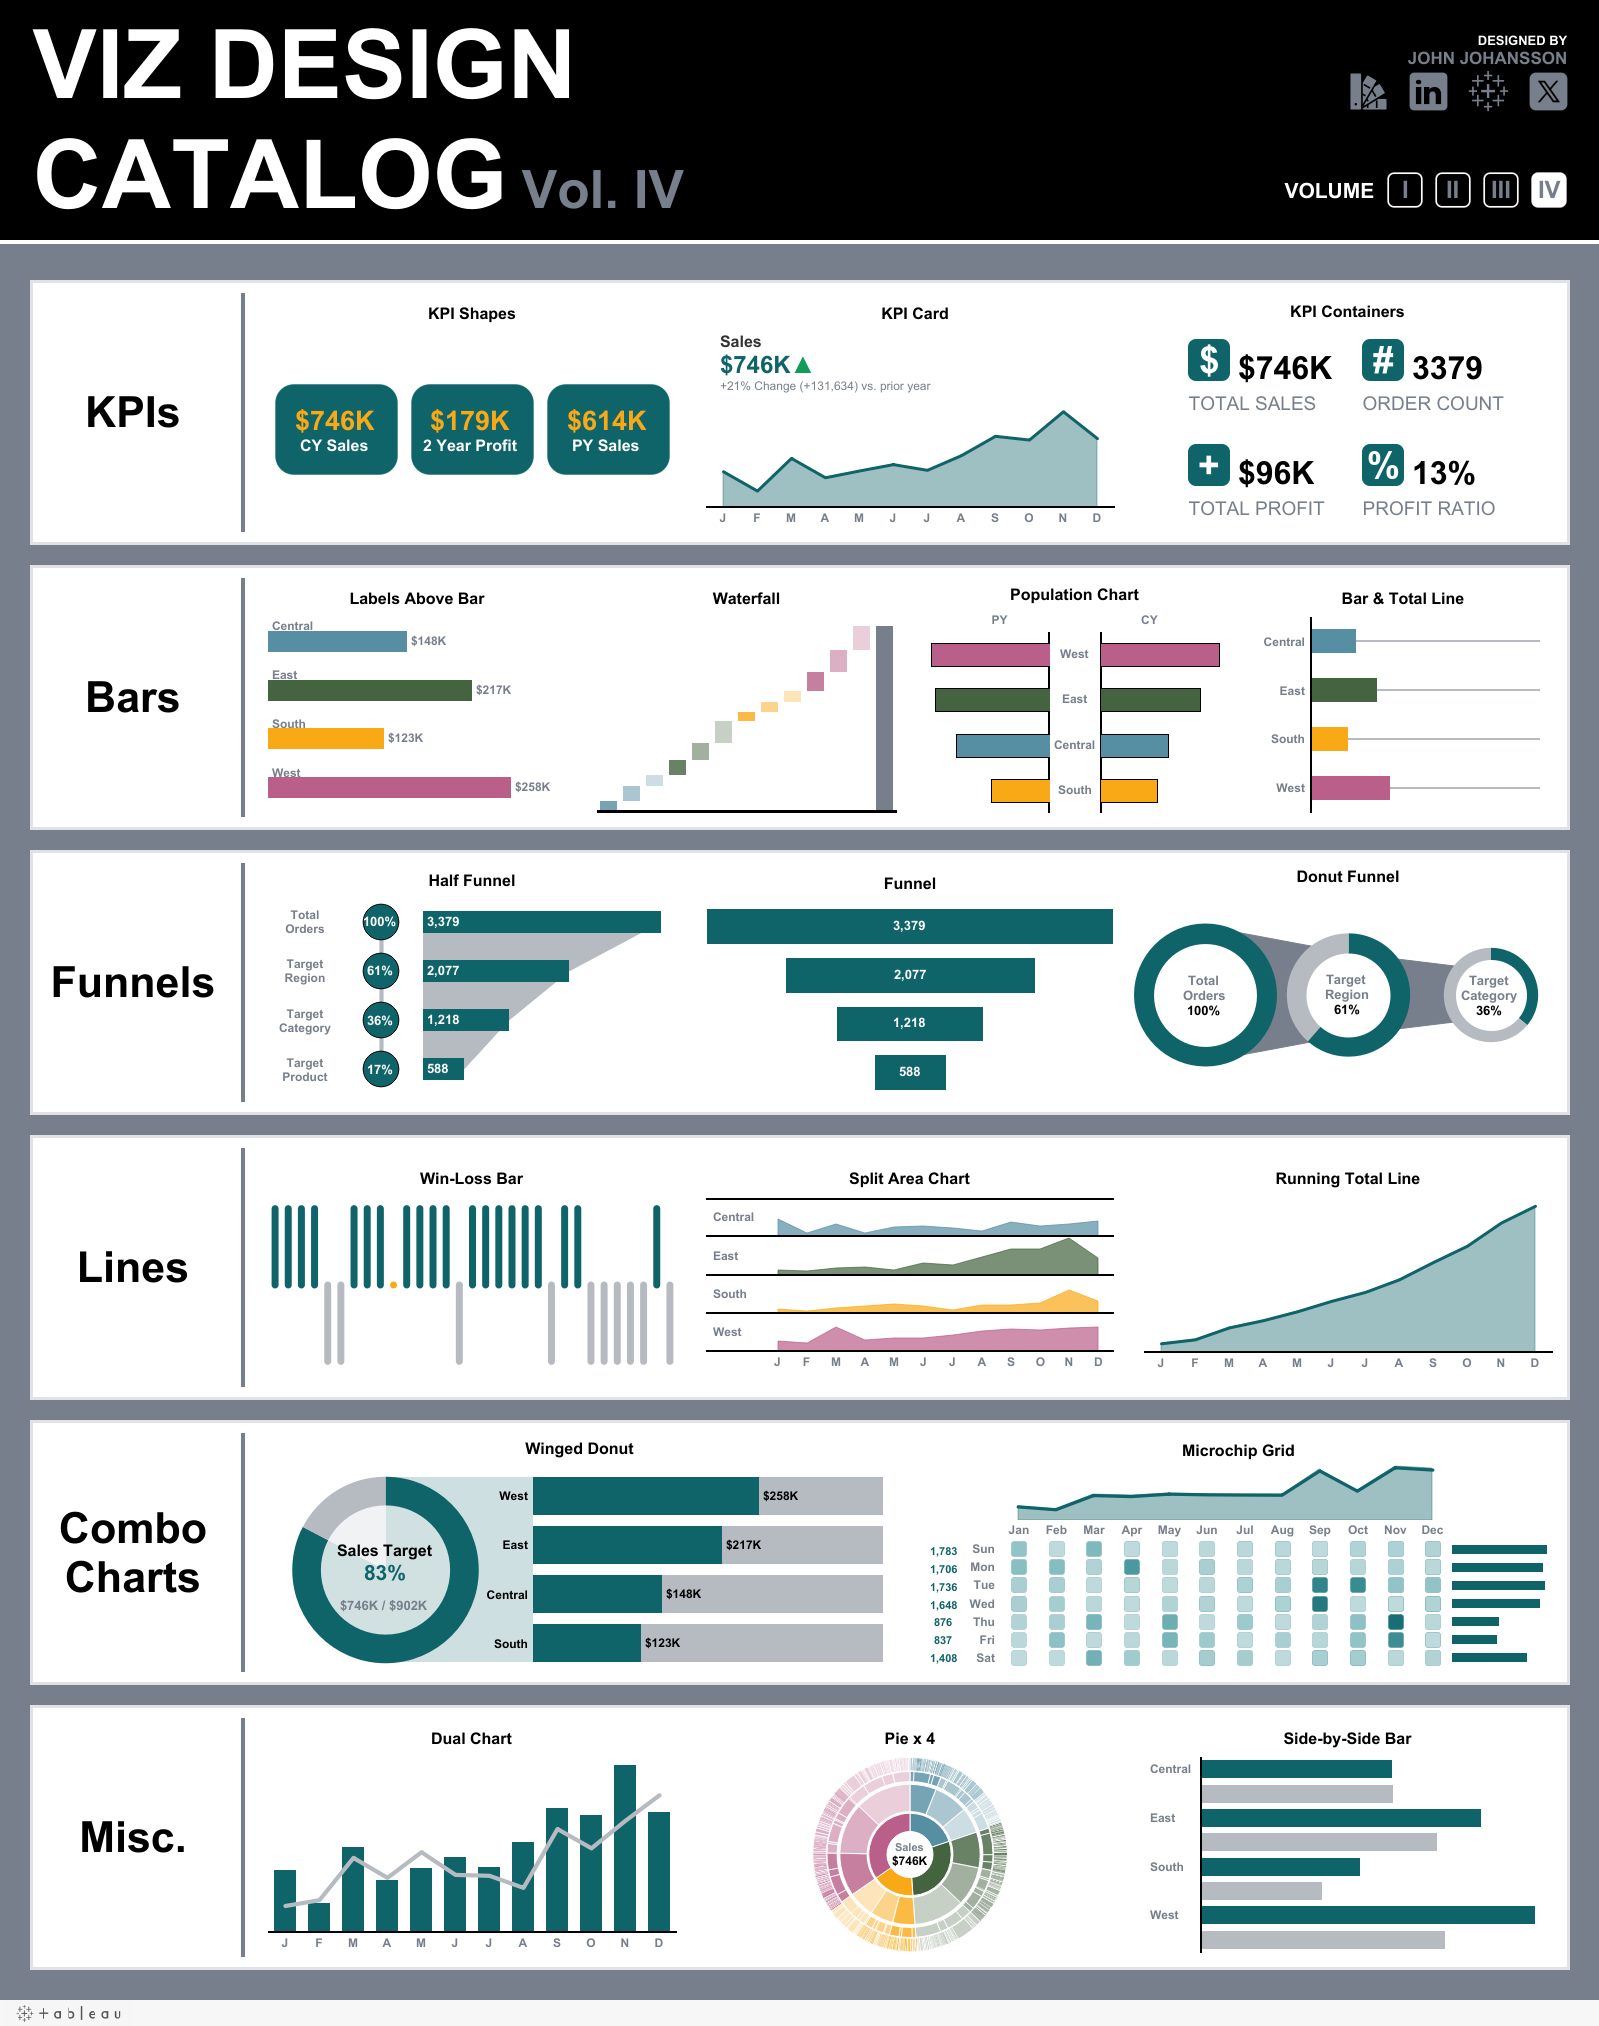
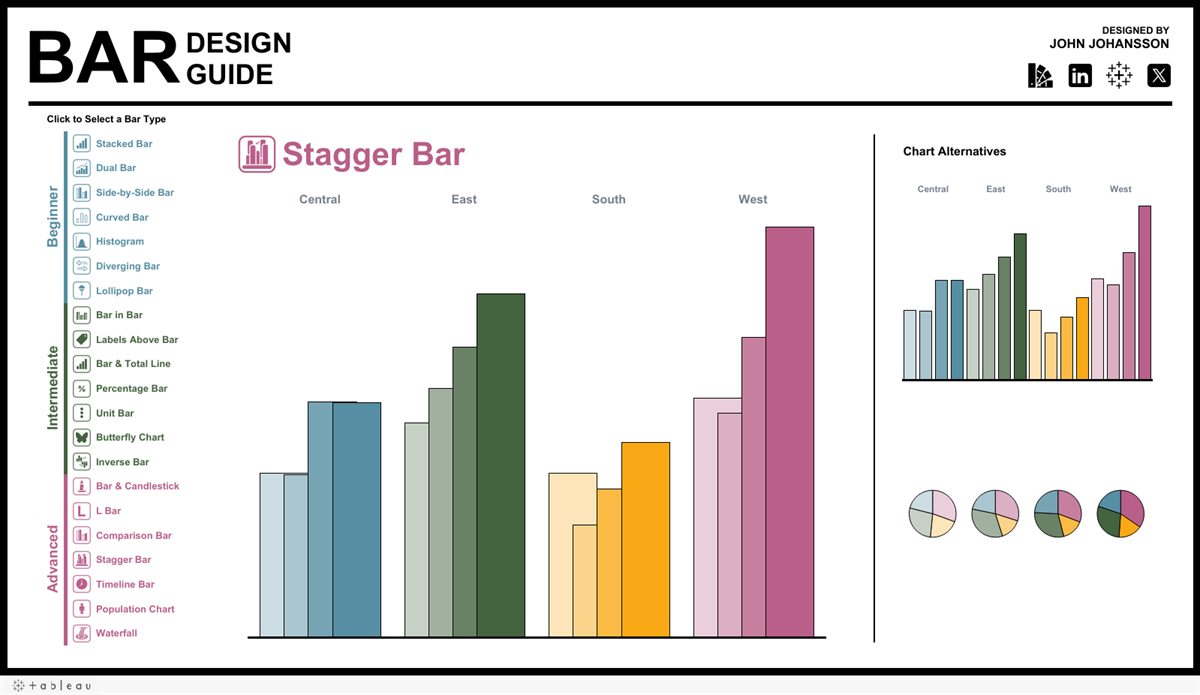
A four-volume reference of more than 80 chart designs, built for training and community content. It covers KPIs, bars, pies, lines, grids, radials, plots, tables, maps, funnels and more.
Viz Design Catalog Vol. I
Viz of the Day
Dashboards
More on Tableau Public
| Dashboard | Series |
|---|---|
| Average European University Costs | #MakeoverMonday |
| Generative AI Search Trends | #MakeoverMonday |
| New Year’s Resolutions | #MakeoverMonday |
| US Presidential Elections | #MakeoverMonday |
| Workforce Productivity Report | #MakeoverMonday |
| The Good, The Bad and The Ugly of Western Movies | Iron Viz 2025 |
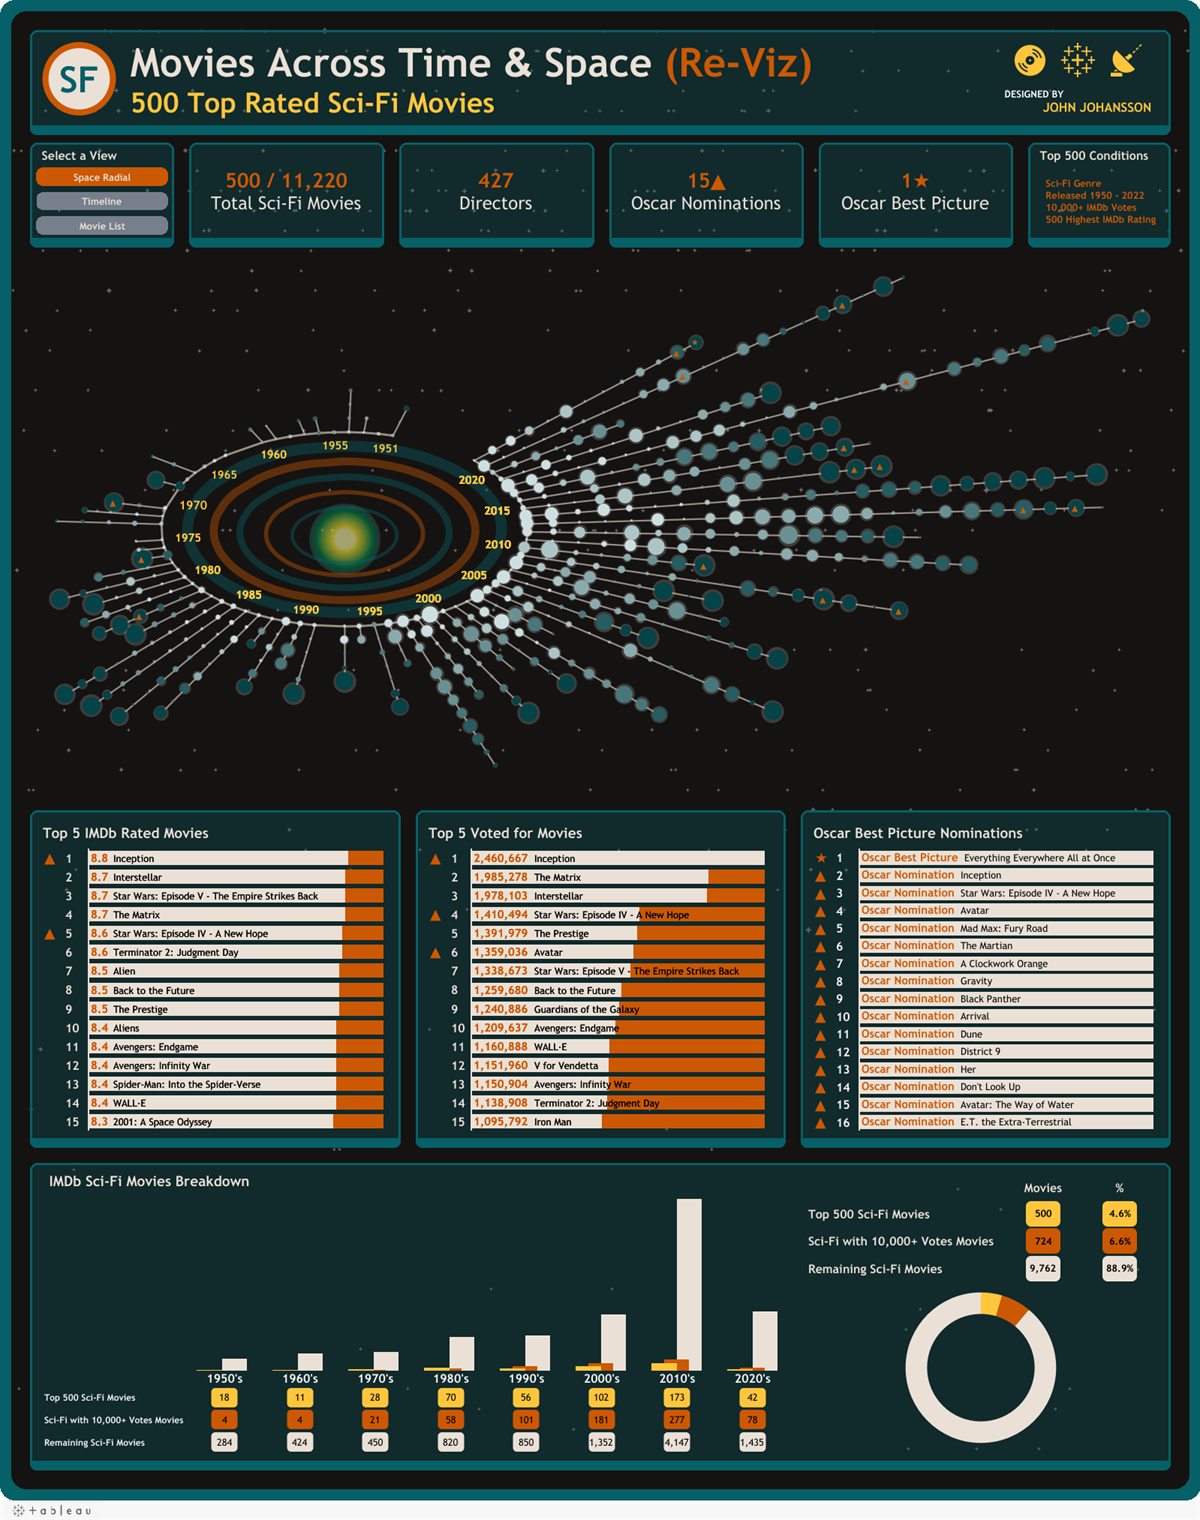
| Movies Across Time & Space (original) | Data + Movies |
| HBCU Catalog | Back 2 Viz Basics |
| No Limits Scatterplot | Back 2 Viz Basics |
| Ode to Du Bois | Back 2 Viz Basics |
| Recorded in Literature | Back 2 Viz Basics |
| Taylor Swift Album Sound Wave | Back 2 Viz Basics |
| U.S. Gas Infrastructure | Energy |
| Run The Jewels: Audio Vibe Waves | Music |
| Franky’s Adventure Supply Sales | Sales |